|
Egwald: Topics in Astronomy and Cosmology - Globular Clusters
by
Elmer G. Wiens
Egwald's popular web pages are provided without cost to users.
Follow Elmer Wiens on Twitter:

Globular Clusters
Introduction
Globular clusters consist of tens, to hundreds of thousands of mainly low mass, old low-metal stars bound together by their mutual gravitational attraction in a dense, slowly
rotating sphere that orbits the center of a galaxy. The stars in these clusters formed when the Universe was still young, from huge clouds of abundant hydrogen and helium
gas that collapsed under each cloud’s internal gravity.
Billions of years ago, after exhausting their core hydrogen, the clusters' most massive luminous stars evolved off the main sequence, fusing helium and heavier elements until
exploding as supernovae.
As red giant stars evolving off the main sequence, less massive stars fused hydrogen in a shell, then also helium in the core, and then hydrogen and helium in shells until they
expelled their atmospheres as planetary nebulae to become white dwarf stars. This process continues today.
The Milky Way galaxy has about two hundred globular clusters.
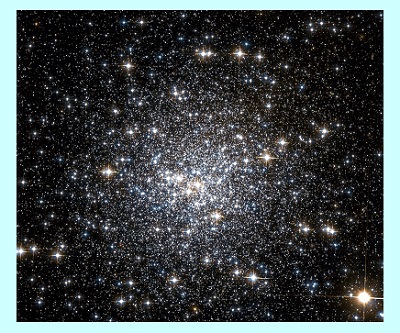
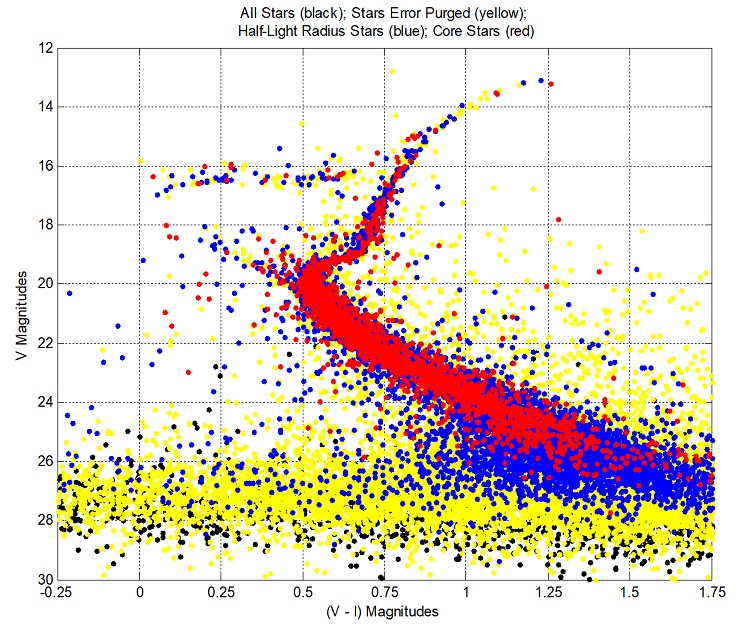
Colour Magnitude Diagram (CMD): NGC 6584
V = apparent visual magnitude, (V - I) = difference in apparent magnitudes as measured in the V and I (infrared) bands
|
Figure 1
|
In the above CMD for the Globular Cluster NGC 6584, the main sequence (MS) of core hydrogen burning stars extends upwards diagonally to the turnoff point at V = 20.
The red giant branch (RGB) stars with cores of inert helium and shells fusing hydrogen into helium extends upwards to the right.
The horizontal branch (HB) of core helium and shell hydrogen burning stars lies to the left of the red giant branch, between 16 and 17 magnitudes.
Soon to become white dwarfs, the bright red giant stars of the asymptotic giant branch (AGB) with luminosities many hundreds of times that of the Sun, and radii about
the distance from the Sun to Venus or more, curl right above V = 14.5.
The wedge of stars extending upward to the left off the main sequence turnoff point contains the blue straggler stars. The luminosities and masses of these core hydrogen
fusing stars are greater than can be explained by the usual evolution of main sequence stars from core to shell fusion of hydrogen.
NGC 6584: Observational Data and Physical Characteristics
Constellation:
Right Ascension:
Declination:
Metallicity [Fe/H]:
E(B – V):
HB V:
|
Telescopium
18h 18m 37.6s
-52⁰ 12’ 56.8”
-1.5
0.1
16.14 Magnitudes
|
Distance:
Distance Modulus:
Core Radius:
Half-Light Radius:
Tidal Radius:
Age:
|
13.75 +/- 1.3 kpc
15.69 Magnitudes
15.6 arc secs
43.8 arc secs
460.4 arc secs
12.5 G-Years
|
The file for NGC 6584 contains 70,632 stars.
Distance to NGC 6584: Distance Modulus V - Mv
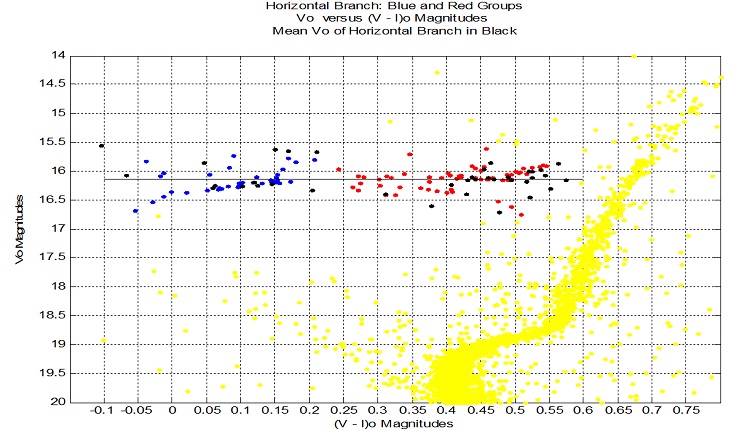
The horizontal branch stars' predictable absolute magnitudes can be used as a standard candle to determine the distance to the cluster.
Interstellar dust diminishes and reddens the measured light from the cluster. The cluster's stars' measured magnitudes were adjusted to produce
their intrinsic magnitudes, V0 and (V - I)0.
The following diagram shows the CMD diagram in the region of the horizontal branch.
|
Figure 2
|
The method used to calculate this distance involves the clusters metallicity, and the HB stars’ average apparent magnitude.
With [Fe/H] = -1.5. and Vave = 16.1427: Mv = 0.894 + 0.31 * [Fe/H] + 0.01 * [Fe/H]2 = 0.4515; Vave – Mv = 15.6912.
Solving: Vave – Mv = 5 * log10(d / 10pc) for d -> d = 13.75 kpc.
The cluster's stars' absolute magnitudes are calculated using the formula: Mv = V – 15.6912.
Age of NGC 6584
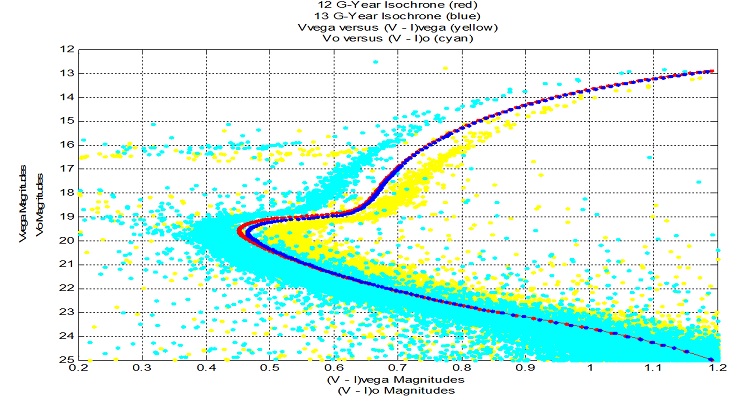
Since globular clusters are the oldest known stellar objects, their ages place a lower limit on the age of the Universe. Isochrones, the theoretical graphs of
stars with equal ages on a V magnitude versus (V – I) colour magnitude diagram, can be used to estimate a cluster’s age.
Isochrones from 9 to 14 G-Years were adjusted with the distance modulus to obtain intrinsic equal age curves in terms of apparent magnitudes. In the diagram below,
the two best fits at 12 and 13 G-Years are matched against the plotted raw data of Vvega versus (V – I)vega, and the intrinsic values of Vo versus (V – I)o,
adjusted for extinction of light from the interstellar medium between the cluster and the Sun.
|
Figure 3
|
Estimate of the age of NGC 6584: 12.5 G-Years.
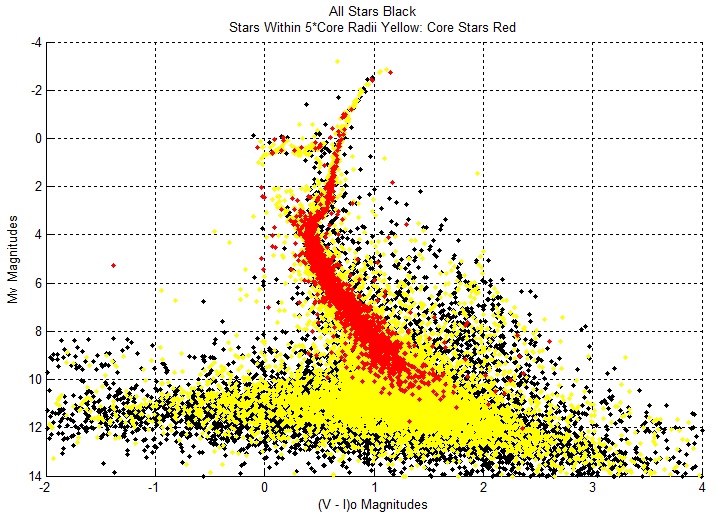
Core Stars
The cluster's core stars lie within a sphere of radius 15.6 arcsecs (1.04 parsecs) around the cluster's center. NGC 6584 has 3172 core stars, and 44,028 stars within 5 * core
radii of its center. The absolute magnitude of its core radius group is -16.375 magnitudes.
|
Figure 4
|
The core stars extend along the main sequence and populate the red giant branch, blue stragglers, horizontal branch, and asymptotic red giant stars.
Cluster Dynamics
A cluster's heavier stars sink to the centre, while lighter stars are more prevalent away from it.
Blue Stragglers
|
Figure 5
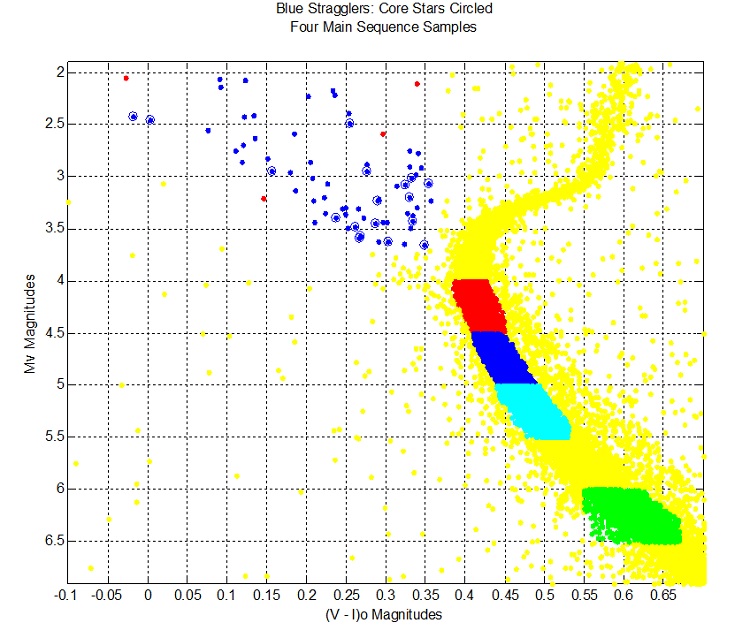
Colour Magnitude Diagram: Absolute Magnitude versus the Intrinsic Apparent Magnitudes (V - I)o
|
In the above diagram, the percentage of blue stragglers within 15" of the centre is double the percentage for each of the four samples along the main sequence.
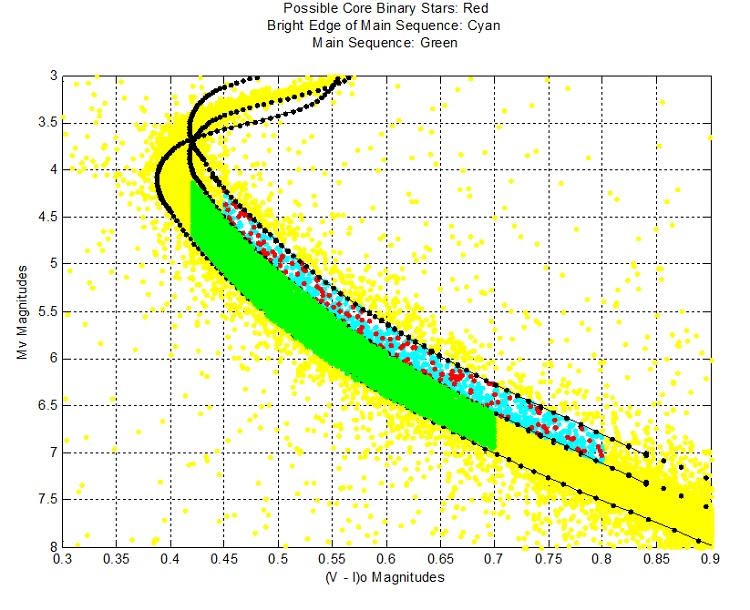
Binary Stars
|
Figure 6
|
In the above diagram, the percentage of stars within 15" in the top strip is almost double that of the lower strip.
The upper strip stars appear more massive than the lower MS stars, because the upper strip contains relatively more binaries. With their combined masses,
binaries tend to gravitate towards the centre, and are relatively impervious to ejection by single stars more massive than the individual members of the binary.
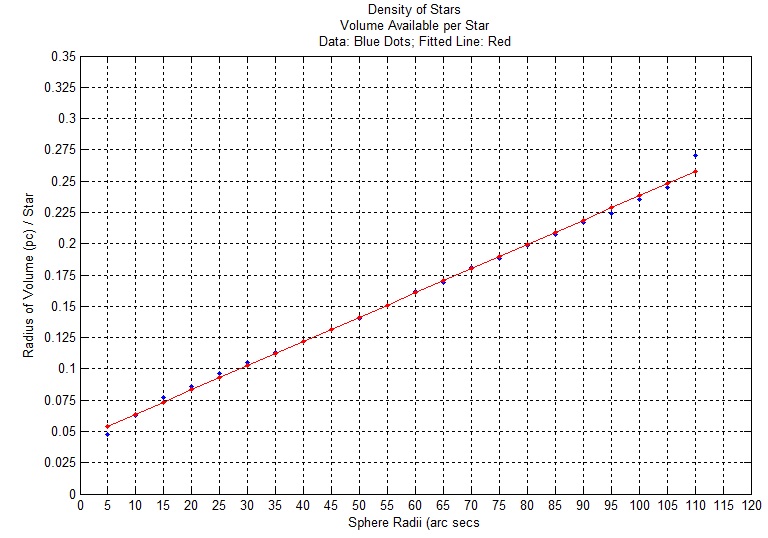
Density of Stars
The half-light radius encloses the stars that account for one-half of the light that the cluster's stars' emit.
One would expect that the volume density of stars in the core of the cluster is considerably greater than the density of stars in the volume between the core and the half-light radius.
The volume available per star is defined as the region's volume / number of stars occupying the region.
Core stars' radius of volume available per star = 0.0708 pc = 14596 AU; half-light stars' radius of volume available per star = 0.1124 pc = 23182 AU.
Replicate the above procedure for spheres with radii from 5 to 110 arcs secs in steps of 5 arc secs to produce the next diagram.
|
Figure 7
|
The fitted line has the equation: Y = 0.04435 + 0.001939 X, where Y = Radius of Volume (pc) / Star and X = Sphere Radii (arc secs).
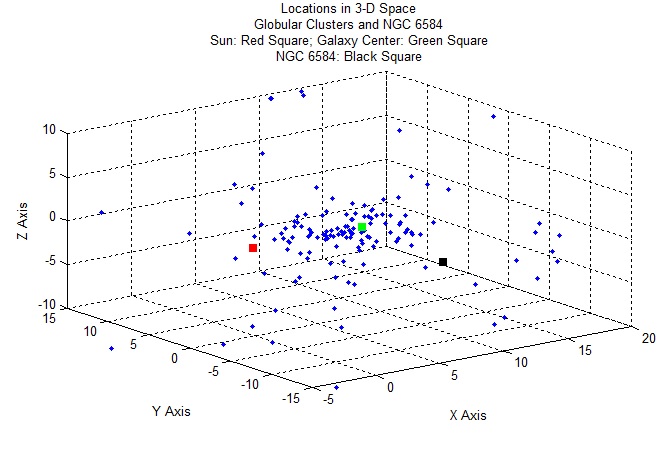
NGC 6584: Location in Space
Galactic distance components X,Y,Z in kiloparsecs, in a Sun-centered coordinate system; X points toward Galactic center, Y in direction of Galactic rotation,
Z toward North Galactic Pole (Harris Catalog (2010). Coordinates of NGC 6584: X = 12.3; Y = -4; Z = -3.8;
|
Figure 8
|
The above diagram shows the distribution of globular clusters (blue points) throughout the Milky Way Galaxy.
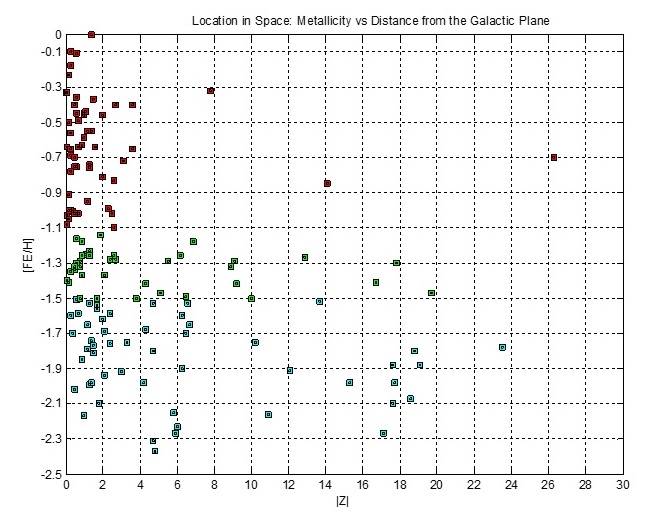
Globular Clusters' Metalicity
The stars of globular clusters formed from massive clouds of hydrogen and helium early in the evolution of the universe. Heavier elements are created by stellar nucleosynthesis
and are found in younger stars formed from gas clouds polluted by these elemetnts by older stars.
|
Figure 9
|
In the figure above, 45 (79%) of Group I's 57 clusters (red) lie within 2 kpc of the Galactic XY plane; 18 (49%) of Group II's 37 clusters (green)
lie within 2 kpc of the plane; and 19 (37%) of Group III's 52 clusters (cyan) lie within 2 kpc of the plane. In total, 82 (56%) of 147 clusters lie along this strip.
Group I's stars are relatively metal rich compared to Group II's stars, etc.
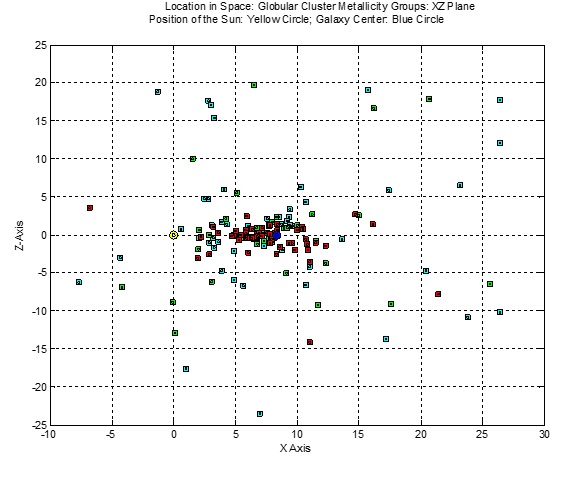
Distribution of Metallicity Groups
The first figure (XZ Plane) below illustrates further the degree to which the Globular Clusters congregate near the XY Galactic Plane.
|
Figure 10
|
|
Figure 11
|
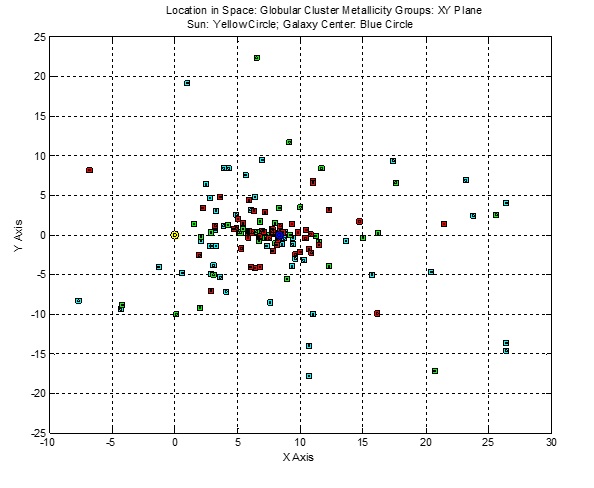
The two figures above illustrate the height and width of the distribution of halo clusters, with Group III (metal poor) clusters dispersed at greater distances than Group II clusters, which in turn
are more dispersed than Group I (metal poor) clusters.
With the Galaxy center established at R0 = 8.33 kpc (blue circle), one expects that symmetry requires that many more undetected Globular clusters exist beyond the center,
with a significant proportion being Group I clusters. Metal rich Group I clusters (red) appear flattened towards the center along the Galaxy disk (along the intersection of the XZ and XY planes).
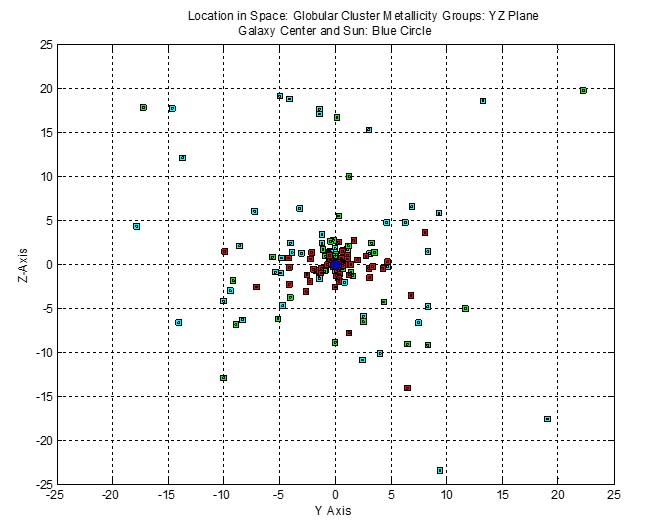
The figure below of the projections of clusters on the YZ plane reveals a more symmetric arrangement of the three Groups’ disbursement.
|
Figure 12
|
The disk of the Milky Way Galaxy has a radius of about 15.33 kpc, and is about 0.31 kpc thick. Its bulge has a diameter of about 3.1 kpc. The disk and bulge are
contained in the intersection of a block and sphere with dimensions:
(-15.33 <= X - 8.33 < = 15.332; 15.33 <= Y < 15.33; -.5 <= Z <= .5) OR (R_gc <= 2).
Of 147 Globular clusters the under consideration, 47% of Group I (27 of 57), 30% of Group II (11 of 37), and only 12% of metal poor Group III (6 of 52) lie in the disk or bulge.
In the Sun’s half of the Galaxy, 65% of Group I (24 0f 37), 42% of Group II (10 of 24), and only 14% (4 of 29) Group III clusters lie in the disk or bulge.
Clusters of Group I are more likely than clusters of Group II to be found in the disk or bulge, while clusters of Group II are more likely than clusters of
Group III in the disk or bulge.
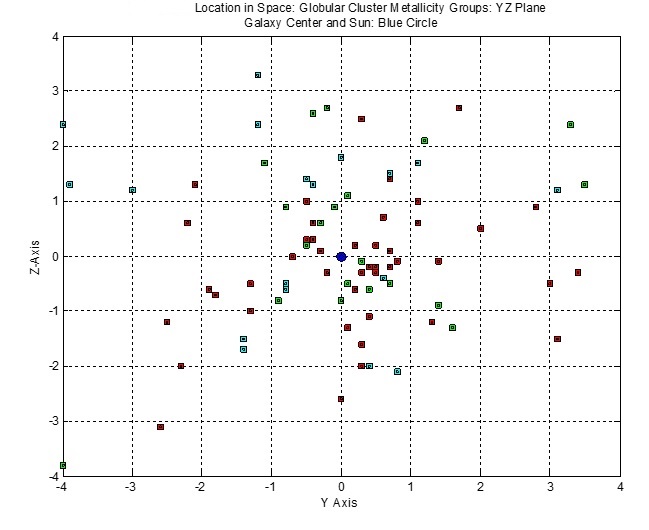
The figure below enlarges the figure above to reveal the distribution of Globular clusters around the Galaxy center. Clusters of each type lie within a
2 kpc sided cube with the origin at the Galaxy center.
|
Figure 13
|
Cube: -2 <=( X – 8.33) < = 2; -2 <= Y <+2; -2 <= Z <= 2;
Group I: 16 of 57 (28%) clusters in cube; Group II: 10 of 37 (27%) clusters in cube; Group III: 6 of 52 (12%) clusters in cube.
On the Sun’s half of the Galaxy, 11 of 37 (30%) Group I clusters, 9 of 24 (38%) Group II clusters, 2 of 29 (14%) of Group I clusters lie in the half cube.
Sphere: R_gc <= 2;
Group I: 15 of 57 (26%) clusters in sphere; Group II: 8 of 37 (22%) clusters in sphere; Group III: 3 of 52 (6%) clusters in sphere.
On the Sun’s half of the Galaxy, Group I: 12 of 37 (32%) clusters in the half sphere; Group II: 7 of 24 (29%) clusters in the half sphere; 1 of 29 (3.5%) clusters in the half sphere.
Clusters of Groups I and II are about equally likely to be found in or near the bulge of the Galaxy, while clusters of metal poor Group III are rare in the bulge and disk.
The Density of Clusters
With Figure 7 above, I found a linear relationship between the median distance to the cluster center of concentric spheres and the average radius of the volume of space available per
star between the concentric spheres.
When I replicate this undertaking for six other clusters, I find similar linear relationships for each cluster up to 110 arc secs from its center. At distances greater than
110 arc secs, all of the graphs became parabolic. I suspect this later relationship has something to do with the way the Hubble Space Telescope (HST) collects the data.
To compare these linear relationships, I converted the arc sec distances to the centre of the cluster to par sec distances using Harris's estimates of the distances between the
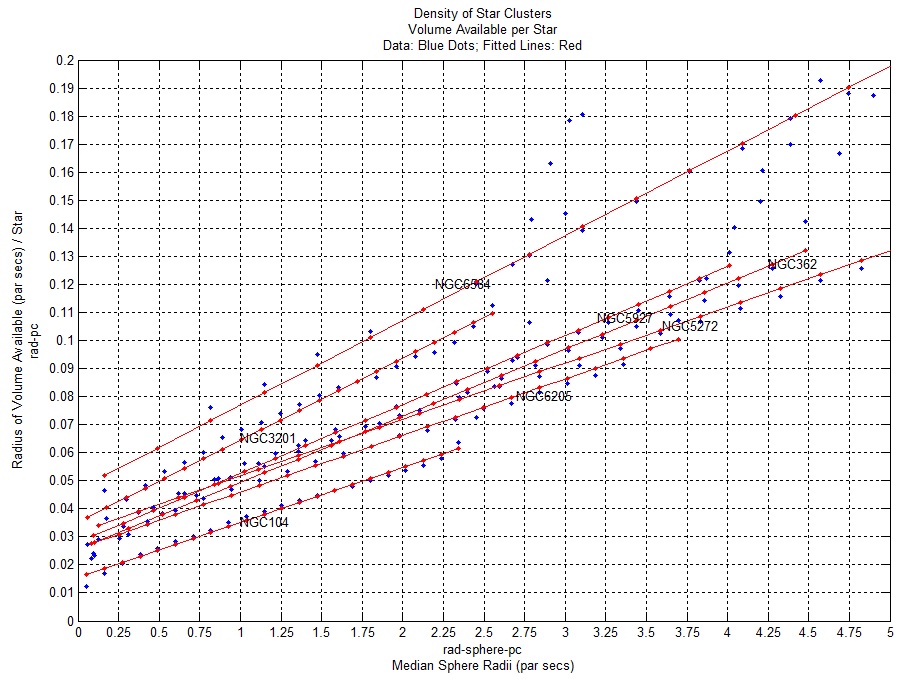
clusters and the Sun (star's distance to cluster's center in par secs = arc sec distance * (1 / 206,265) * distance to the Sun in par secs). The graphs of these linear fits appear on Figure 14 below.
|
Figure 14
|
|
Linear Relationships: Distance to the Sun = R_Sun par secs;
rad_pc = Radius of Volume Available (pc) / Star; rad_sphere_pc = Median Sphere Radii (pc)
Cluster NGC104: R_Sun = 4.5 * 10^3 pc; rad_pc = 0.0154 + 0.0197 * rad_sphere_pc
Cluster NGC362: R_Sun = 8.6 * 10^3 pc; rad_pc = 0.0255 + 0.0238 * rad_sphere_pc
Cluster NGC3201: R_Sun = 4.9 * 10^3 pc; rad_pc = 0.035 + 0.0292 * rad_sphere_pc
Cluster NGC5272 (M3): R_Sun = 1.02 * 10^4; rad_pc = 0.0316 + 0.0201 * rad_sphere_pc
Cluster NGC5927: R_Sun = 7.7 * 10^3; rad_pc = 0.0281 + 0.0246 * rad_sphere_pc
Cluster NGC6205 (M13): R_Sun = 7.1 * 10^3; rad_pc = 0.0257 + 0.0202 * rad_sphere_pc
Cluster NGC6584: R_Sun = 1.35 * 10^4; rad_pc = 0.0468 + 0.0302 * rad_sphere_pc
Average Linear Relationship: rad_pc = 0.0298 + 0.0240 * rad_sphere_pc
|
Assuming these linear relationships reflect some underlying dynamical physical process, I am intrigued as to why they should be linear, and which variables determine the slopes
of these linear relationships, other than, perhaps, the number of stars in the cluster and the age of the cluster.
Looking at some other variables that Harris provides, I notice core relaxation time, and median relaxation time.
I gather (http://www.astro.caltech.edu/~george/ay20/Ay20-Lec15x.pdf) these variables depend also on the number of stars in the cluster,
the age of the cluster, and the orbital velocity of the stars.
Globular Cluster Parameters
The globular cluster data used here come from: Harris, W.E. 1996, AJ, 112, 1487 (2010)
http://www.physics.mcmaster.ca/~harris/mwgc.dat.
The values by globular cluster of the parameters in this catalog can be used to derive relationships between and among these parameters (variables) to understand
their inter-connections.
For example, let us investigate the determinants of the central luminosity density of clusters defined as the solar luminosities per cubic parsec (variable rho_0).
Can the value of rho_0 for a given cluster be predicted on the basis of the cluster’s metallicity (variable [FE/H]), the ratio of its tidal radius to its core
radius (variable c), and whether its core has collapsed (variable c:).
The actual variables used are:
rho_0 = log10(solar luminosities per cubic parsec) = central luminosity density,
[FE_H] = [Fe/H] = metallicity,
c = log10(r_t/r_c) = log10(tidal radius / core radius) = King-model central concentration,
c: = 1 if core collapsed; c: = 0 otherwise
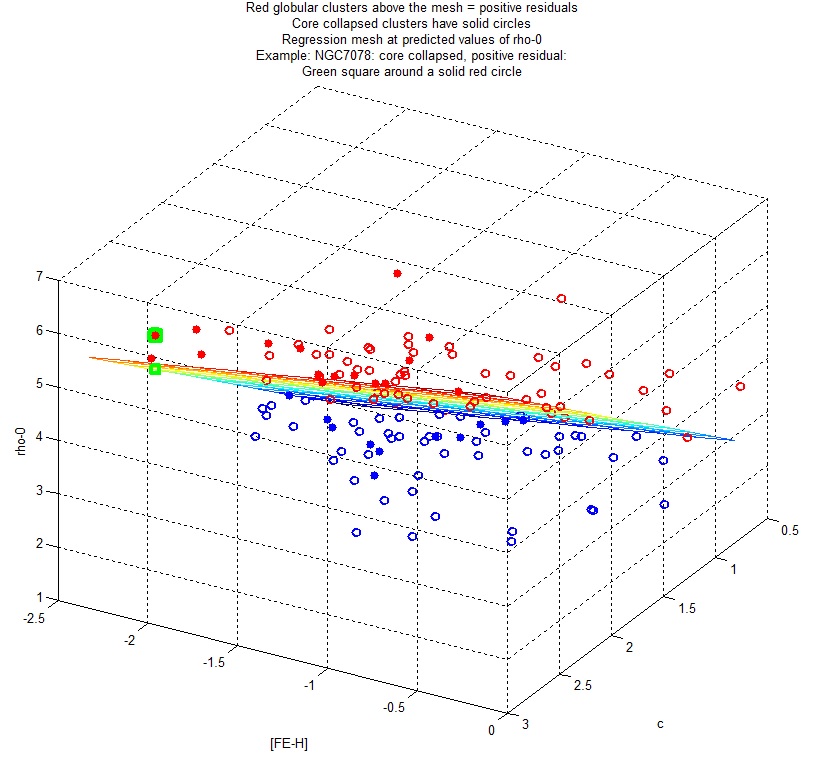
Regression: rho_0 versus ([FE_H], c, c:)
Regression Result:
rho_0 = 1.3584 + 0.5287 * [FE_H] + 1.8158 * c + 0.1399 * c:
stats.beta = 1.3584 0.5287 1.8158 0.1399
stats.tstat.t = 4.4362 3.9689 10.9952 0.5996
stats. rsquare = 0.6357; stats.adjrsquare = 0.6274; stats. mse = 0.7643
Number of observations: 136 of 157 clusters had complete data for each of the regression variables
These results are depicted visually in the following 3D diagram.
|
Figure 15
|
The data set used in the regression appears in the following link to the PDF where: p_rho_0 = predicted central luminosity density, residual = rho_0 - p_rho_0:
Harris Regression Data Set.
References
Durrell, Patrick R. and William E. Harris. "A Color-Magnitude Study of the Globular Cluster M15." 1993, AJ, 105, 1420.
http://adsabs.harvard.edu/abs/1993AJ....105.1420D
Fregeau, John M. "Binary Stars and Globular Cluster Dynamics." 2007, Proceedings IAU Symposium No. 246, 239.
http://journals.cambridge.org/download.php?file=%2FIAU%2FIAU3_S246%2FS1743921308015676a.pdf&code=c394fa5dc3d9422a79829c68c457666d
Harris, W.E. "A Catalog of Parameters for Globular Clusters in the Milky Way." 1996, AJ, 112, 1487. (2010 Edition)
http://physwww.mcmaster.ca/~harris/mwgc.dat
Henault-Brunet, Vincent. "Multiple Populations in Globular Clusters: Constraints from Kinematics and Dynamics." 2015, Proceedings IAU Symposium No. 316.
http://arxiv.org/pdf/1512.02039v1.pdf
King, Ivan R. "The Structure of Star Clusters. III. Some Simple Dynamical Models." 1966. AJ, 71, 64.
Sarajedini, A. & Forrester, W. L. "CCD photometry for the galactic globular cluster NGC 6584." 1995, AJ, 109., 1112.
http://adsabs.harvard.edu/full/1995AJ....109.1112S
Richer, Harvey (2016). Astronomy 205: Stars and Stellar Populations. Univesity of British Columbia Course Notes.
Toddy, Joseph M. "New Variable Stars in the Globular Cluster NGC 6584." 2013, JSARA, 6, 00-00.
http://arxiv.org/pdf/1205.1034v1.pdf
Wikipedia: Blue stragglers. https://en.wikipedia.org/wiki/Blue_straggler
|